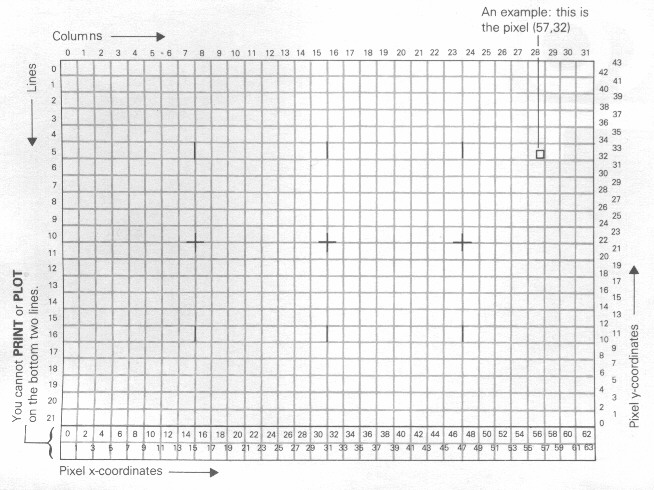
Here are some of the most elegant features of the ZX81; they use what are called pixels (picture elements). The screen you can display on has 22 lines & 32 columns, making 22*23 = 704 character positions, & each of these contains 4 pixels, divided up like a slice of Battenburg cake.
A pixel is specified by two numbers, its coordinates. The first, its x-coordinate, says how for it is across from the extreme left-hand column (remember, X is ACROSS), & the second, its y-coordinate, says how far if is up from the bottom. These coordinates are usually written as a pair in brackets, so (0,0), (63,0), (0,43) & (63,43) are the bottom left-, bottom right-, top left-, & top right-hand corners.
The statement
PLOT x-coordinate, y-coordinate
blacks in the pixel with these coordinates, while the statement
UNPLOT x-coordinate, y-coordinate
blanks it out.
Try this measles program:
10 PLOT INT (RND*64),INT (RND*44)
20 INPUT A$
30 GOTO 10
This plots a random point each time you press NEWLINE.
Here is a rather more
useful program. It plots a graph of the function SIN (a sine wave)
for values between 0 & 2![]() .
.
10 FOR N=0 TO 63
20 PLOT N, 22+20*SIN (N/32*PI)
30 NEXT N
This next one plots a graph of SQR (part of a parabola) between 0 & 4:
10 FOR N=0 TO 63
20 PLOT N,20*SQR (N/16)
30 NEXT N
Notice that pixel coordinates
are rather different from the line & column in an AT item. At
the end of this chapter is a diagram which you may find useful in working
out pixel coordinates & line & column numbers.
Exercises
1. There are three differences between the numbers in an AT item & pixel coordinates; what are they?
Suppose that the PRINT
position corresponds to AT L,C (for line & column). Prove to
yourself that the four pixels in that position have x-coordinates 2*C or
2*C+1, & y-coordinates 2*(21-L) or 2*(21-L)+1. (Look at the diagram.)
2. Make a cheese nibbler by altering the
measles program so that it first fills the screen with black (a black square
is an inverse video space), & then unplots random points, if you have
only 1K of memory - that is to say, the standard machine without any extra
memory, - you will find yourself running out of store, so you will have
to fix the program so that it uses only part of the screen.
3. Modify the SIN graph program
so that before plotting the graph itself it prints a horizontal line of
"-"s for an x-axis, & a vertical line of "/"s for a y-axis.
4. Write programs to plot graphs of more functions, e.g. COS, EXP, LN, ATN, INT & so on. For each one you will have to make sure that the graph fits the screen, so you will need to consider
(i) over what range
you are going to take the functions (corresponding to the range 0 to 2![]() for the SIN graph).
for the SIN graph).
(ii) whereabouts on the screen to put the x-axis (corresponding to 22 in line 20 in the SIN graph program).
(iii) how to scale the y-axis of the graph (corresponding to 20 in line 20 of the SIN graph program).
You will find that
COS
is the easiest - it's just like SIN.
5. Run this:
10 PLOT 21,21
20 PRINT "HEAVY QUOTES"
30 PLOT 46,21
PLOT moves on
the PRINT position. (UNPLOT does too.)
6. This subroutine draws a (fairly) straight line from the pixel (A,B) to the pixel (C,D).
Use it as part of some main program that supplies the value of A, B, C & D.
(If you have not got a memory expansion board then you'll probably need to omit the REM statements.)
1000 LET U=C-A
1005 REM U SHOWS HOW MANY STEPS ALONG WE NEED TO GO
1010 LET V=D-B
1015 REM V SHOWS HOW MANY STEPS UP
1020 LET D1X=SGN U
1030 LET D1Y=SGN V
1035 REM (D1X,D1Y) IS A SINGLE STEP IN A DIAGONAL DIRECTION
1040 LET D2X=SGN U
1050 LET D2Y=0
1055 REM (D2X,D2Y) IS A SINGLE STEP LEFT OR RIGHT
1060 LET M=ABS U
1070 LET N=ABS V
1080 IF M>N THEN GOTO 1130
1090 LET D2X=0
1100 LET D2Y=SGN V
1105 REM NOW (D2X,D2Y) IS A SINGLE STEP UP OR DOWN
1110 LET M=ABS V
1120 LET N=ABS U
1130 REM M IS THE LARGER OF ABS U & ABS V, N IS THE SMALLER
1140 LET S=INT (M/2)
1145 REM WE WANT TO MOVE FROM (A,B) TO (C,D) IN M STEPS USING N UP- DOWN OR RIGHT-LEFT STEPS D2, & M-N DIAGONAL STEPS D1, DISTRIBUTED AS EVENLY AS POSSIBLE
1150 FOR I=0 TO M
1160 PLOT A,B
1170 LET S=S+N
1180 IF S<M THEN GOTO 1230
1190 LET S=S-M
1200 LET A=A+D1X
1210 LET B=B+D1Y
1215 REM A DIAGONAL STEP
1220 GOTO 1250
1230 LET A=A+D2X
1240 LET B=B+D2Y
1245 REM AN UP-DOWN OR RIGHT-LEFT STEP
1250 NEXT I
1260 RETURN
| The last part (lines 1150 on) mixes the M-N step D1 evenly with the N steps D2. Imagine a Monopoly board with M squares round the edge, numbered from 0 to M-1. The square you are on at any time is number S, starting at the corner opposite G0. Each move takes you N squares round the board, & in the straight line on the screen you make either a left-right/ up-down step (if you pass GO on the board), or a diagonal step otherwise. Since your total journey on the board is M*N steps, or right round N times, you pass GO N times & evenly spaced out in your M steps are N left-right/up-down steps. | 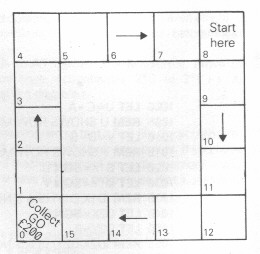 |
Adjust the program so that if another parameter, E, is 1 then the line is drawn in black (as here), & if it is 0 then the line is drawn in white (using UNPLOT). You can then rub out a line you've just drawn by undrawing it.